Predicting NHL Team Success
- bsample301
- Apr 15, 2025
- 3 min read
In baseball there is a way to predict a team’s win percentage based on the amount of runs that they score and the amount of runs that they give up. It is called the Pythagorean Expectation. The formula is this:
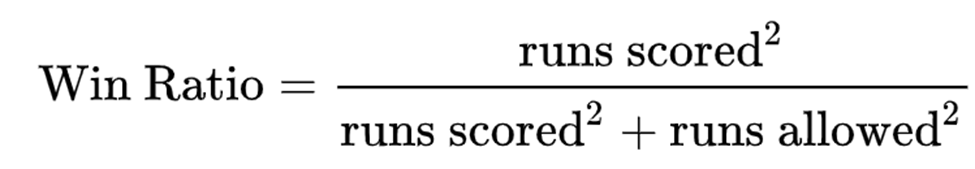
This formula was developed by Bill James, where the 2 for the exponent is what has been used for a while and it seems to work.
For the most part, people have tried to use this formula for other sports too. People have tried to replicate it for basketball, hockey, and even in football, where the formulas are kind of similar. I have this class called Statistical Reasoning in Sports (shoutout Mr. Prugh), where we do a bunch of stats things with sports.
The other day we were working with this formula and trying to do it with other sports as well. He showed us a little trick called the “What-If Analysis” where you can put all the data in, and it will try out other exponents for you and see which one has the best error between the actual number and the projected number so you don’t have to do it all by hand.
So, because of this, I wanted to try this for hockey.
I tried Win Percentage, and using that same formula, I got around the same exponent. Between 2 and 2.1 is what worked for the two seasons I did, with a Mean Absolute Deviation of around 0.02, which is a good error to have.
The error is the absolute value of the actual percentage minus the projected percentage, and the Mean Absolute Deviation is the average of all those errors for the teams, so you want the lowest error possible.
This got me thinking, how can I do this with Point Percentage? The reason for this is, while Win Percentage is important in hockey, it isn’t the biggest and it isn’t really used. People use Point Percentage to detail how good a team is, because of the point you get for an overtime loss.
So, I got to work trying out different exponents. I first off the tried the original formula, and seeing which exponent gave me the best error. Again, I got the exponent of 2. But, the error was around 0.05, which is a lot higher than the one for the Win Percentage.
Next I tried:
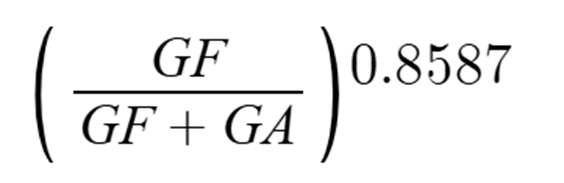
Here I got the exponent of 0.8587 as giving me the best error, and this error was better, it was around 0.042, which was better than the original error that I got. But, I knew there had to be a better way to get it so I kept trying.
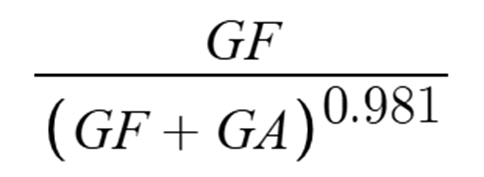
The next one I tried worked even better. I got an error of around 0.037, and got an exponent of 0.981 using a different formula. The formula I used was:
This seemed to work better, and I tried to use this variation, while also putting the GF on top to a power, but I got the same exponent as the one before, 0.859, and around the same error of 0.042.
I tried another formula, getting around the same result as the one before that one, I used:
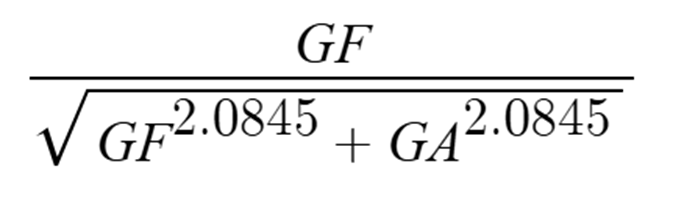
I used this formula because it is pretty much the same as the actual formula for the hypotenuse on the bottom. With the exponent of 2.0845, I got an error of 0.037, around the same error I got for a previous one that I did.
I felt like I was stuck but I knew I could do better. The next one I tried seemed the be the one to work the best. I got an exponent of 1.9845, with an error of 0.028, I used the formula:
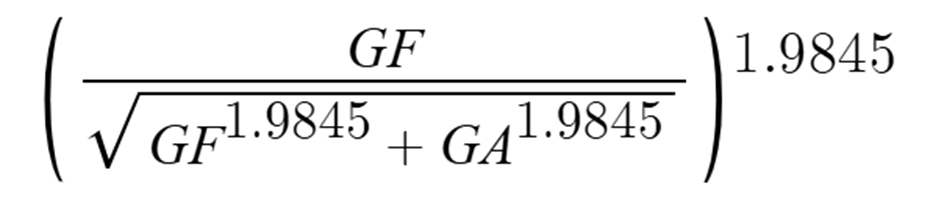
This one seemed to be the money. I got a very low error, and a way to predict Points Percentage based on the amount of goals they score and the goals they give up.
The data I used for this was the 2023-24 season, I used the same formula to try and do it for the 2022-23 season, and I got an error of 0.019, which is even better. So I think this is a great way to predict Points Percentage from the amount of goals scored


Comments